Inundation Percentage & Margin of Error
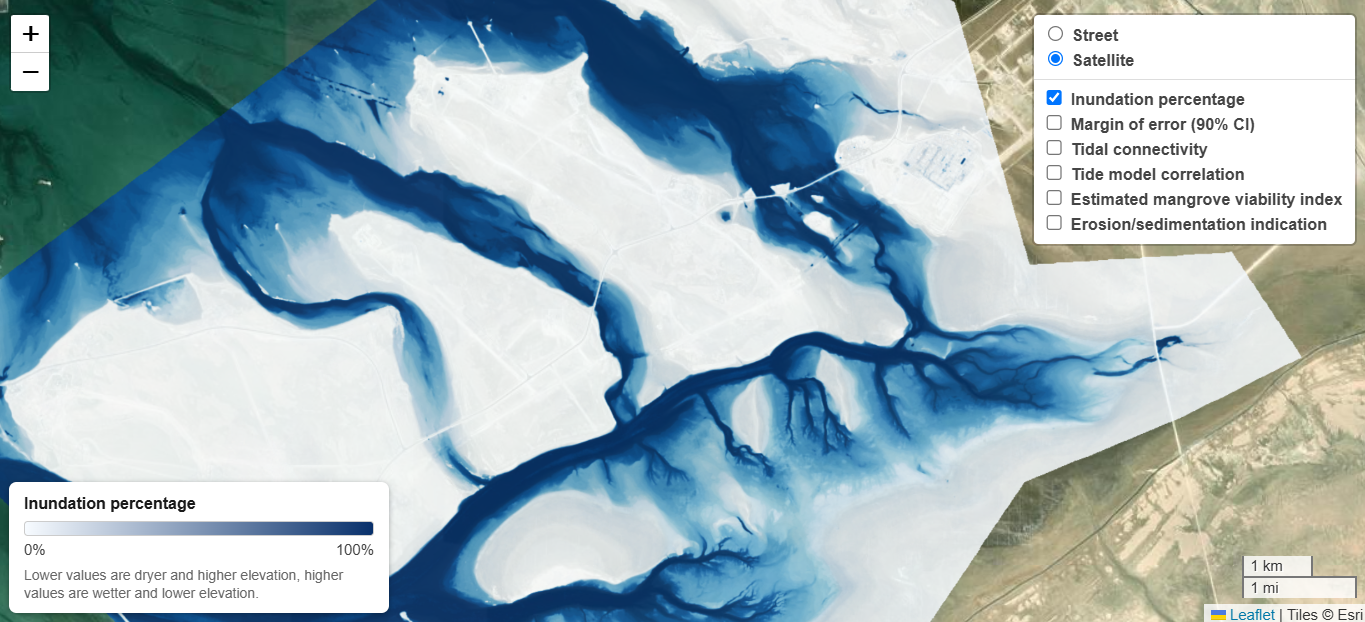
This section uses satellite imagery to measure the percentage of the time the site is inundated. Area with higher inundation spend more time wet, and are likely therefore lower in the tidal zone. Lower inundation suggests a dryer and likely higher position in the tidal zone.
- Values of 0% indicate no inundation, and therefore dry land.
- Values of 100% indicate permanent inundation, and therefore deep or permanent water.
- Values between 0 and 100% indicate tidal activity or some other cause of temporary inundation (irrigation, weather, etc).
This is critical information as inundation rates are one of the key factors in identifying mangrove habitat. This is strongly correlated to the local hydroperiod and elevation, which can be estimated when combined with a locally valid tide model. Different mangrove species in different regions are adapted to specific inundation frequencies, and this information can be used to identify the exact niche where diverse local species are most likely to establish (combined with other factors). The inundation percentage can also be used as a factor for site stratification.
Methodology
Using imagery from the Sentinel 2 satellite mission (up to 10m in resolution), the normalised difference water index (NDWI) is used to detect inundated areas, classifying them as "dry" or "inundated". This is calculated for every image captured within the input date range (roughly 3 to 4 times per month), ignoring areas that are cloud covered or have other issues. It is important to note that NDWI only correctly classifies open areas, and the presence of vegetation will mean it may not correctly clasify "dry" vs "inundated" in such areas.
For each 10m pixel, an inundation percentage is calculated as the percentage of time that pixel is inundated. A pixel with an inundation of close to 100% is always underwater and is likely deep, permanent water. A pixel with an inundation of 0% is likely dry land. And most interesting are the pixels with inundation values between 0% and 100%, as these are typically the intertidal zone where mangroves can grow. The inundation percentage is directly correlated to the local terrain height, with "more inundated" areas typically being lower, and "dryer" areas being higher, so this can also be used to build an intertidal terrain map. For more information on connecting space based inundation measurements with validated local topological models, reach out to Inverto Earth.
For very cloudy areas, or short input date ranges, there are not many valid "dry or "inundated" classifications, and as a result the estimation of the inundation percentage is more uncertain. To quantify this, the margin of error in inundation percentage at a 90% confidence interval is also calculated and visualised. Areas with higher margin of error have more uncertainty in the estimate of inundation percentage, and their results should be treated with more caution.
The output maps produced by this method are the following:
- Inundation percentage = (number of scenes a pixel was classified wet) / (number of scenes the pixel had a valid, cloud-free observation), shown as a percentage.
- Margin of error treats that percentage as a binomial proportion and reports the half-width of a 90% confidence interval for it. A pixel showing 60% inundation with a 10% margin of error means the true frequency is most likely between 50% and 70%.
Limitations & sources of error
- Fixed overpass time. The satellite flies over each site at approximately the same local time each pass. Normally, this is sufficient to capture a unbiased view of most of the tidal range, as the tide cycle shifts consistently over the date range. However, it there are locations and time ranges where a component of the tide cycle occurs roughly at a 24 hour frequency, which leads to a bias in the captured satellite data. This can result in either the upper or the lower areas of the intertidal area not being properly mapped.
- Canopy/vegetation. Over vegetated mangrove/marsh, NDWI sees the canopy, not necessarily the water beneath it. Inundation frequency under dense canopy is frequently underestimated.
- Turbidity. High sediment load changes water's spectral signature meaning that the NDWI method of classifying dry and wet areas may not perform as reliably.
- Glint or sun glare. In deeper water, sun glare or glint can also affect the spectral signature, and result in misclassified areas in deep water with inundation percentages less than 100%.
- The margin of error assumes independent observations with a fixed true probability. This is estimated using only the number of valid observations for each pixel. If the observations are correlated in some way, possibly due to weather events or other occurances, this assumption is no longer valid. It also doesn't account for uncertainty in the NDWI based classification of inundation, which can be affected by turbitity, soil reflectance properties and other parameters.
References
- Bishop-Taylor, R. et al. (2019). Between the tides: Modelling the elevation of Australia's exposed intertidal zone at continental scale. Estuarine, Coastal and Shelf Science.
- Murray, N. J. et al. (2019). The global distribution and trajectory of tidal flats. Nature, 565, 222–225.
- Brown, L. D., Cai, T. T., & DasGupta, A. (2001). Interval Estimation for a Binomial Proportion. Statistical Science, 16(2), 101–133 — comparison of binomial confidence interval methods and the basis for preferring Jeffreys here.
-
Kumbier, K. et al. (2021). Inundation characteristics of mangrove and saltmarsh in micro-tidal estuaries. — see also Mangrove Viability Index.
-
Duke, N.C and Kleine, D. (2007). Mangroves prime facts, https://www.dpird.nsw.gov.au/__data/assets/pdf_file/0004/634252/mangroves.pdf
-
Duke, N. C. et al (1998). Factors Influencing Biodiversity and Distributional Gradients in Mangroves Global Ecology and Biogeography Letters 7:27-47
-
Oh, R.R.Y. et al (2016). The role of surface elevation in the rehabilitation of abandonedaquaculture ponds to mangrove forests, Sulawesi, Indonesia Ecological Engineering.
Inundation and mangroves
Mangroves are intertidal species, and can only grow in areas with regular tidal inundation. There are many other factors that impact mangrove growth, including temperature/climate, salinity, exposure and wave energy, and many others, however inundation is a critical factor. Different mangrove species are adapted to grow at different levels of inundation, and therefore at lower or higher areas in the intertidal zone. It is always recommended to use local knowledge or field data to assess local mangrove species and their preferred inundation percentages when deciding on restoration actions. Very roughly, mangroves grow best within a range centred roughly around 40% inundation percentage (see Kumbier et al. 2021), however this is very species and site dependent.
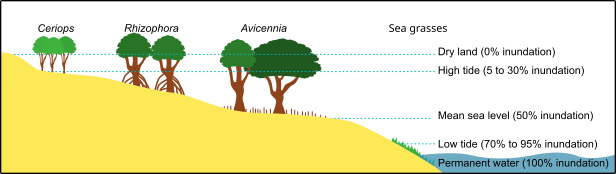
The image above shows how inundation frequency is a critical factor in mangrove zonation. The image is adapted based on Duke (2007), which is for mangrove species in NSW in Australia, and literature or site data should be assessed for the actual site of interest to investigate local mangrove zonation.