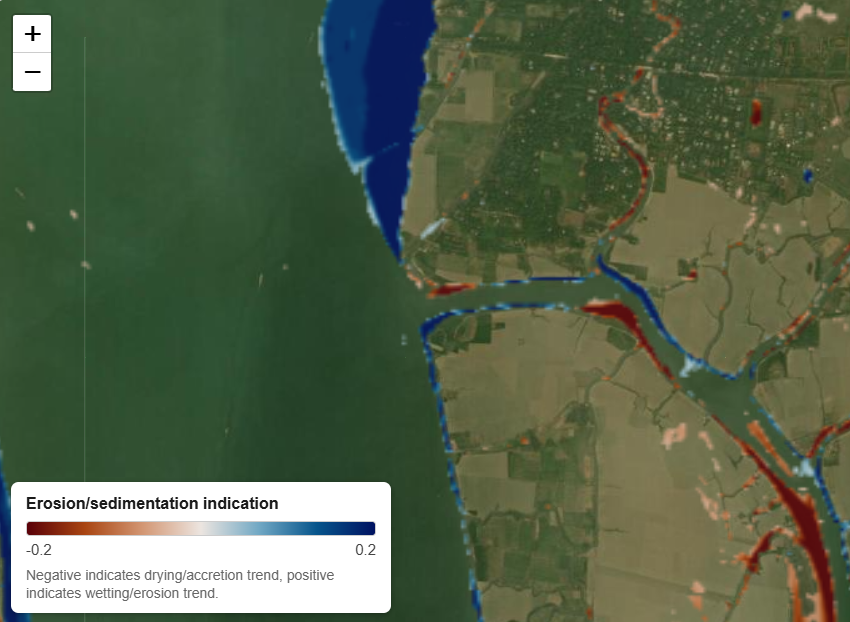
Erosion/sedimentation trend
This layer serves as an indication for whether a site's hydrology is stable, wetting, or drying over recent years, which acts as an early warning for erosion, sediment accretion, or changing tidal exchange that could threaten a restoration site's long-term viability.
- Positive values indicate a "wetting" trend, stronger with larger values, and therefore likely erosion, indicated as blue in the web viewer.
- Negative values indicate a "drying" trend, stronger with more negative values, and therefore likely accretion, indicated as red in the web viewer.
Coastal habitats are often highly dynamic, and if a site is viable for mangrove restoration this year it may not remain viable in the future. While mangroves are excellent at reducing coastal erosion, if upstream flow dynamics have caused disturbances to sediment flow, sites even with mature and well established mangroves may be at risk of erosion. This layer is also useful to detect erosion and sedimentation trends which could affect local communities and their farmlands as well.
As this is only a coarse and satellite based analysis, it is intended only to highlight potential risks which could be worth closer investigation in field data. For more information on hydrological trend modelling, and in particular long term risk and coastal dynamics, please reach out to Inverto Earth.
Methodology
This looks at trends in the inundation percentage per pixel over the last 3 years from the input analysis end date, or more than 3 years if a longer date range is input. It always uses a whole number of years for the analysis to minimise seasonal effects.
If a pixel's inundation percentage is increasing over that time range, this is evidence that it is moving lower in the tide range likely due to erosion. If the reverse occurs, and the inundation is decreasing, this suggests that sediment is building up at that location. Only regions where the trend is assessed as significant are visualised.
Limitations & sources of error
- Seasonal or extreme weather events Coastal habitats are highly dynamic, with many temporary causes of erosion or sedimentation conditions. Severe weather events could lead to erosion or sedimentation within the analysis time period, but that are not indicative of long term trends.
- Causes of hydrodynamic changes As these habitats are so dynamic, areas with erosion can often switch to accretion conditions over periods of years due to upsteam flow changes, or human activity such as dams or irrigation can cause changes in sediment flow that change erosion conditions suddenly. This assessment only looks at the trends within the analysis period, which may not be indicative of the future trend due to activities or events outside the AOI.
References
- Murray, N. J. et al. (2019). The global distribution and trajectory of tidal flats. Nature, 565, 222–225.
Use for mangrove restoration
Evidence of site erosion is a critical risk for long term stability of mangroves, and large, region wide erosion can be indications of reduced sediment supply which can affect mangrove nutrition over the long term as well. Sites with very dynamic topology may also indicate additional risk for long term projects, particularly carbon projects.
Changing topology through sedimentation and erosion can additionally affect local inundation rates, which affects mangrove habitat and potential species distributions. It can lead to mangrove stands moving over time as the coastal environment changes. It can also make sites more vulnerable to changing sea levels, or extreme weather or tide events.
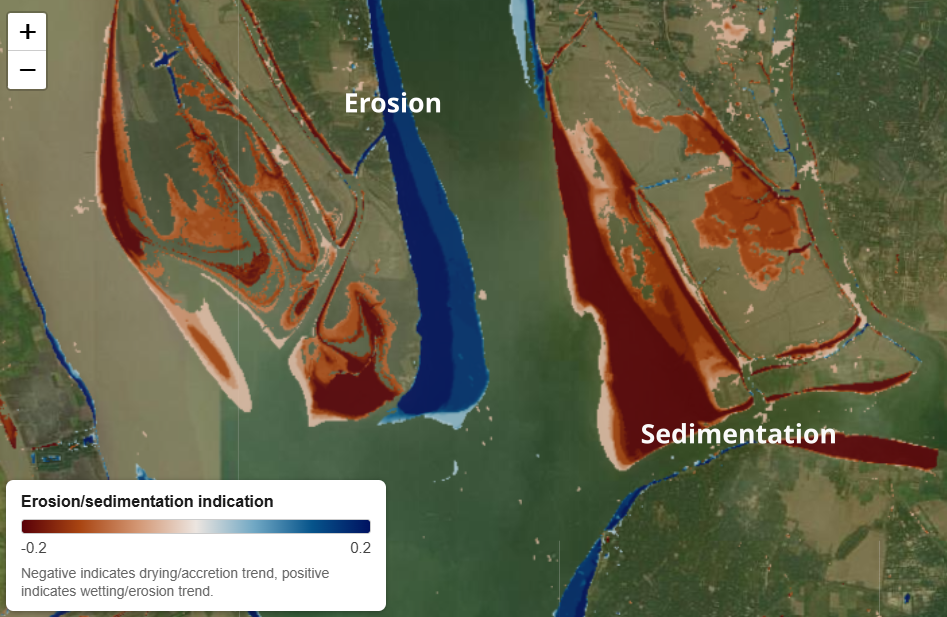
See the image below as an example of both erosion and accretion/sedimentation. In the left of the channel, likely due to higher flow speeds as the channel slightly curves, the blue indicates a wetting trend and that inundation percentage has been increasing, and the local elevation is likely decreasing. On the right side of the channel, the flow is likely slower, and the red colours indicate the inundation percentage has been decreasing, a drying trend, and the local elevation is likely increasing due to sedimentation. This suggests that the left side of the channel is likely risky for a mangrove restoration project, even if the site has viable inundation characteristics and tidal connectivity. Of course, this should be verified with field data before any final decisions. The small lighter coloured pixels in the deeper water are likely from noise, or possibly resulting from uncertainty in the inundation percentage values.
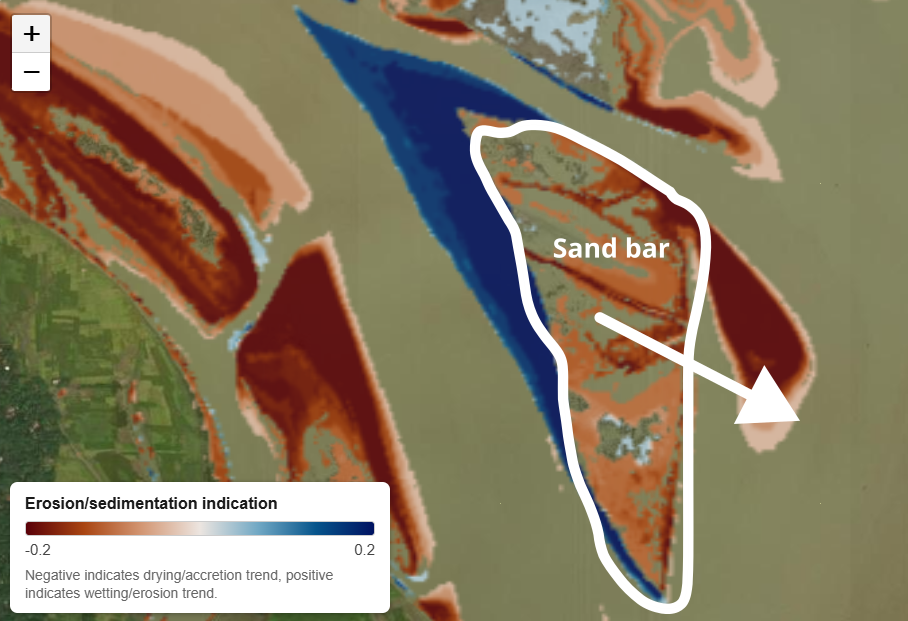
The image below shows a highly dynamic sand bar, which may temporarily be viable for mangrove establishment, but if historical data shows the sand bar to be continuously moving, then it is likely too dynamic for long term mangrove establishment. The left side of the sand bar shows indications of erosion, and the right side shows sedimentation, so we would also expect this sand bar to move eastwards in the near future.
As an example of where this layer can also help identify risk areas for local communities and infrastructure, the image below shows a site in the Sundarbans where mangrove forest has been cleared for farmland (on the right of the image). A levee has been built to protect the farmland, but the blue area on the left of the image indicates this area currently has a likely erosion trend and this levee probably needs active maintainance to prevent flooding, and could be at additional risk in storm and flood events.