Tidal Connectivity
The inundation percentage alone is not an indication of tidal flows, sites can be periodically inundated due to other reasons such as weather or leaks. For this, the tidal connectivity index is used.
This index is a measurement of how likely each pixel is to be wet, at the same time as most of the other pixels in the image. Essentially, if a pixel is more likely to be wet when most of the area is wet, then its inundation signal is probably tidal. If this is not the case, so the pixel is occasionally dry when most areas are wet, then it indicates that whatever causes that pixel to be "inundated" is unrelated to the cause for the rest of the area.
- Values close to 1 indicate the inundation patterns are correlated with the rest of the AOI (area of interest), shown as blue in the web viewer. This suggests they are tidally connected.
- Values close to 0.5 indicate the inundation patterns are uncorrelated with the rest of the AOI, shown as pale/cream in the web viewer. This suggests they are disconnected from the tides.
- Values below 0.5 indicate a negative correlation with the rest of the AOI, shown as red in the web viewer. This would suggest the area gets wetter as most of the area gets dryer, and vice versa. This would be an indication of something strange.
This is useful as it indicates pixels that are likely tidally connected and that share inundation patterns, as well as highlighting areas where tidal flow has been disrupted. Crucially, it does this without relying on tidal models, so it can be used in complex riverine or delta environments where tidal models may be less accurate. This is the key difference between tidal connectivity and tidal correlation, as tidal connectivity compares the inundation signal across the AOI and highlights pixels that share inundation patterns with the majority, and tidal correlation measures specifically the per pixel inundation correlation with a global tidal model.
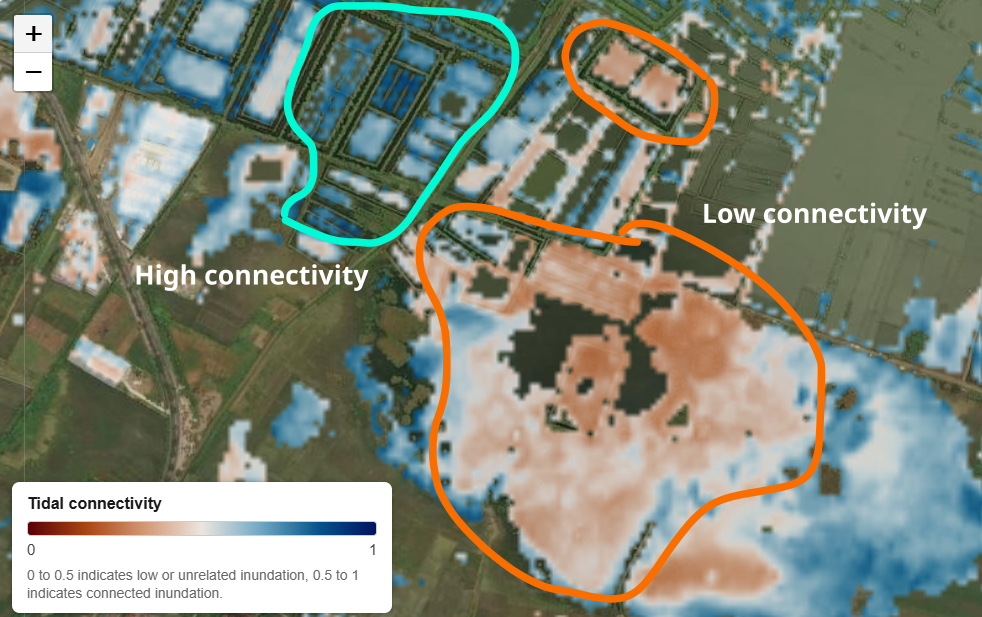
The image below shows an a region with many aquaculture ponds. The small ponds circled in orange appear to have inundation patterns that don't match the wider region, so this is likely evidence that they are active aquaculture ponds with controlled water flow. The larger area in orange may not be active ponds, however there is a levee separating that area from the water to the north, so this indicates it is not strongly connected to the tides and there may be some blockage. The blue sites circled in cyan have higher connectivity, indicating that the inundation there generally matches the rest of the surveyed region. These could still be aquaculture ponds, however there is evidence that their inundation patterns and therefore likely the water level rises and falls with the tides.
Methodology
The analysis is restricted to an intertidal zone, specifically pixels with inundation frequency between a 2% and 80%. The lower bound excludes pixels that are essentially always dry, the upper bound excludes deep/permanent water, where the wet/dry signal saturates and stops being informative about tidal connectivity specifically.
For each pixel, tidal connectivity is the AUC (area under the curve) of a Mann-Whitney U statistic: the probability that a randomly chosen scene where this pixel was "inundated" had a higher scene-wide inundation percentage than a randomly chosen scene where it was "dry". An AUC of 1.0 means the pixel is wet in exactly the more-inundated scenes and dry in the rest. An AUC of 0.5 means no relationship at all, and a value between 0 and 0.5 means the relationship is inverted, so that pixel is more often dry when other areas are wet. Essentially, values between 0.5 and 1 suggest tidal connectivity, with values closer to 1 suggesting open and uninterupted flow. Values closer to 0.5 suggest some form of disturbed tidal flow, and values below 0.5 are a strong indication of non-tidal inundation patterns.
Limitations & sources of error
- Dependent on input area The index only compares the pixels within the area of interest (AOI) given as input. If the AOI does not include truly tidal areas (for example, it only covers disconnected ponds, or rocky or vegetated coastlines), then there is no "true" tidal signal for comparison and this index is no longer meaningful.
- Needs enough scenes in both states. A pixel needs a minimum number of both wet and dry observations (5 of each by default) to get a score at all, so sparse time series leave gaps in this map, distinct from a high margin of error in the inundation percentage map.
- No indication of sufficient tidal flow. The tidal connectivity index only indicates that there is some connection for that pixel so it inundates with similar patterns to the rest of the AOI. This is evidence of tidal connection, however it does not show how well the areas are connected. It could be possible to have tidal connectivity but the connection only allows slow draining, or the connection does not sufficiently provide enough nutrients or refreshed water for mangrove growth.
References
- Kumbier, K. et al. (2021). Inundation characteristics of mangrove and saltmarsh in micro-tidal estuaries. — see also Mangrove Viability Index.
Tidal connectivity and mangroves
Tidal connectivity can indicate if hydrological interventions such as breaching levees or digging channels are necessary. It can also indicate areas where inundation is not tidally driven, which could be due to irrigation controlled inundation for fish ponds, or other causes. If there are naturally growing mangroves close to the project site, with good tidal connectivity, it may not be necessary to conduct active planting, and hydrological interventions may be the most effective step. Before deciding on any restoration intervention however, be sure to check local conditions and data and make sure you have a solid understanding for the current causes preventing natural mangrove establishment.