Tidal Correlation
This index specifically tracks how closely each pixels inundation pattern matches a global tide model. Global tide models can be very useful in predicting inundation ranges over longer time periods, and can also be used to relate inundation with local elevation, however their performance can vary across different locations.
- Values near 1 indicate strong positive correlation with tide model predictions, and that the tide model matches inundation patterns.
- Values near 0 indicate no correlation with tide model predictions, and that the tide model is likely inaccurate at these locations.
- Negative values indicate a negative correlation with tide model predictions, suggesting that there there is some connection between the tide model and inundation, however there could be significant lag in the tide phase timings.
This index acts as a first check to see if the global tidal model performs well in the local area, as well as helping confirm estimates of tidal connectivity assessed in the tidal connectivity section. Note that these values are only meaningful over intertidal areas, low values over deep water do not indicate problems with the tidal model.
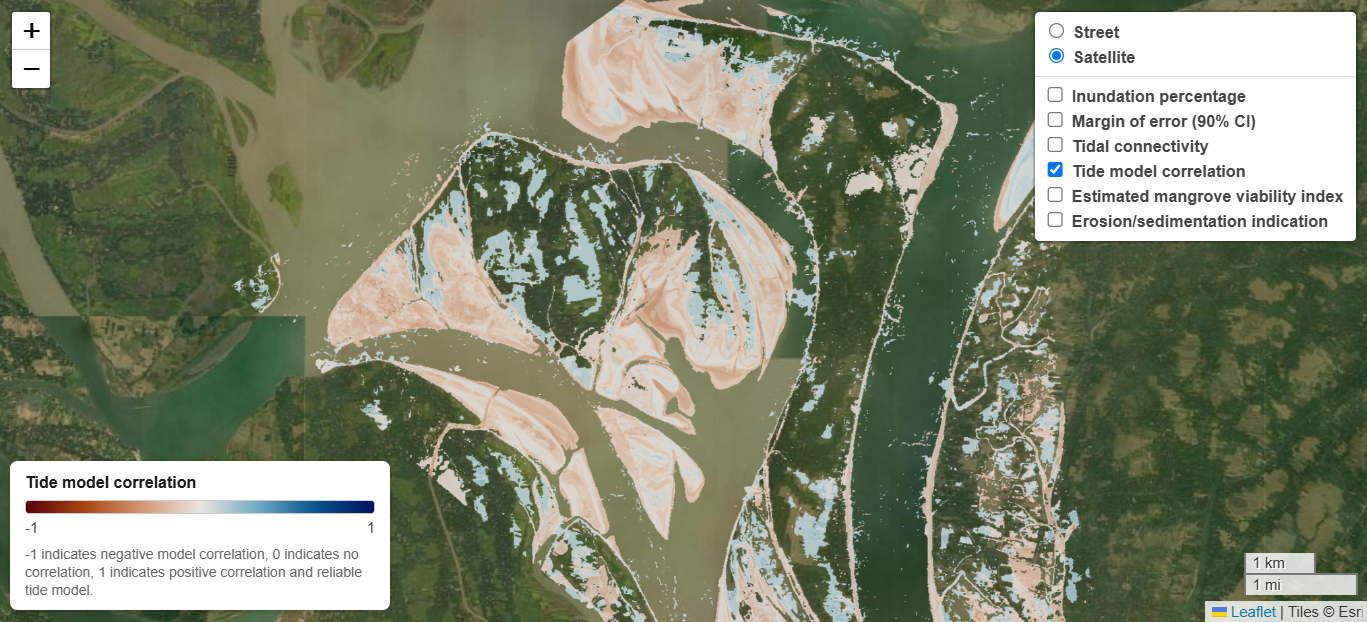
As an example of the difference between tidal connectivity and tidal correlation, see the images below. They are from an area in the Sundarbans of Bangladesh, a very complicated tidal delta environment. In the first image, we see positive tidal connectivity values, showing that the intertidal areas are all well connected and inundate at around the same times.
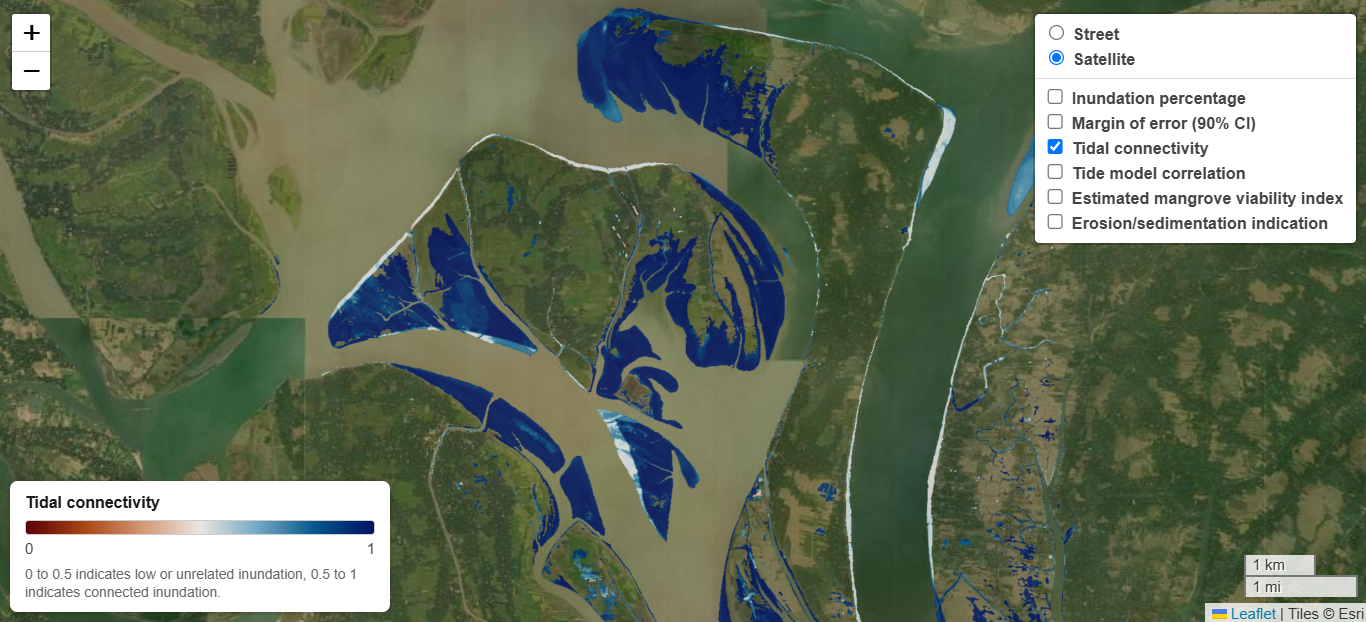
In the next image showing tidal correlation, we see the tidal correlation in the same areas is low. This indicates the tide model predictions do not match the observed inundation patterns, and suggests that the global tidal model is not reliable in this area. Indeed, as this is in the complicated Sundarban delta, an environment that is challenging for tidal predictions, so it is to be expected. Based on this, local tide measurements could be especially valuable to measure the actual tidal range at such locations, as the tide model is not reliable.
Methodology
This step uses the EOT20 global tidal model to predict tide heights within the AOI (Area of Interest). As the AOI is limited to 15 000 ha, tidal variation within the AOI is expected to be small, so only a single tide height is predicted. Over larger and more complicated topologies, this assumption of a single tide height is no longer valid, and a more complicated approach is required.
For every pixel, this is a Pearson correlation between its per-scene wet/dry status (from NDWI) and the modelled tide height at each scene's acquisition time. Values near +1 mean the pixel reliably floods as the tide rises, values near 0 mean no relationship to the modelled tide at all, and values of -1 would indicate a negative correlation.
Limitations & sources of error
- Single point tide prediction. One tide prediction point is used across the entire area of the AOI. In a large or hydrologically complex estuary, tide phase and amplitude can vary across it, meaning the single tide prediction may not be accurate.
- Global tide model accuracy. Global tide models are built and validated on networks of tide sensors, and are not built to fully capture local site complexities. They may not perform well in remote, under studied regions without nearby tide gauges for validation. This can be checked in the output however, if exposed, open intertidal areas do not correlate with the tide model, the tide model may have accuracy issues in that region.
References
- Hart-Davis, M. G. et al. (2021). EOT20: a global ocean tide model from multi-mission satellite altimetry. Earth System Science Data, 13, 3869–3884.
Tidal correlation and mangroves
This acts as a first check if global tide models perform well in the area of interest, as well as confirming the tidal connectivity in the case it does perform accurately. Ensuring the tide model is locally accurate is crucial if using it to predict extreme weather risks, sea level rise, and if using it to generate estimates of intertidal topology or elevation maps.