Tidal Cycle
This is a plot shown only in the generated PDF report, used to show the site tidal regime. It uses the same global tide model used in the tide correlation plots, so if those images suggest the tide model doesn't perform well in the region of interest, then these plots are also less likely to be accurate.
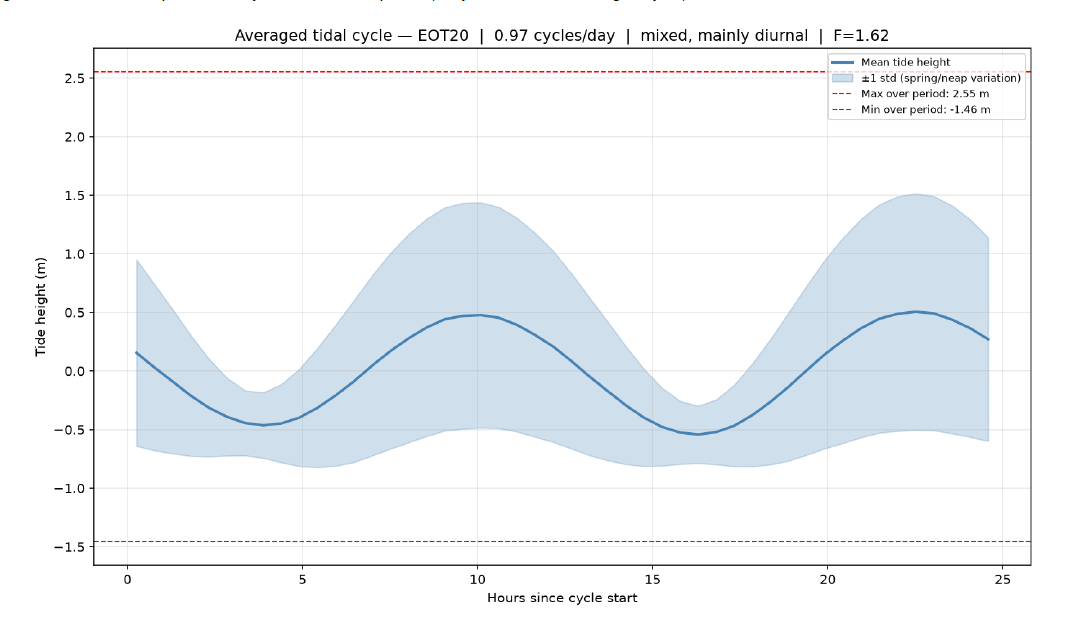
The plot shows a characteristic tidal cycle, as well as the bounds within one standard deviation (roughly spring and neap tides) as well as the maximum and minimum tide within the analysis date range. The analysis indicates if the cycle is roughly diurnal (single high tide and low tide over 24 hours) or semidiurnal (two high tides and two low tides each 24 hours). This tidal range can be used to better understand the range of conditions on site, especially as a site visit is unlikely to be for long enough to see the full tidal cycle. As an example, the image below shows a site with a mixed tidal cycle.
Methodology
This plot is generated only using the tide model, and does not use any satellite inputs. It models the tide cycle at only a single location, and assumes that the site is small enough that the tides are the same across the area of interest (AOI). This assumption may not hold true in locations with many complicated channels and topology. It is also fully reliant on the performance of the tide model, which should be checked using the tide correlation maps before assuming it is accurate in the AOI. Especially in complicated delta or riverine environments, the tide model may not predict accurate results.
As it is only showing tide model results, it also doesn't account for weather events, freshwater flow from rivers, or flooding, and so the actual tide ranges may be affected by low pressure weather systems, floods, and so on.
The tide plot shows the main tide cycle for visualisation, however real tides are compositions of many different tide frequencies that drift in and out of phase. For mixed diurnal and semidiurnal systems, this simple tide cycle plot may be slightly misleading, as it shows only the most typical tide cycle shape.
Limitations & sources of error
- Single point prediction, as for the tide correlation plots, only a single point is used for tide prediction and it is assumed tide is roughly constant across the small AOI.
- A single averaged cycle does not fully represent a mixed regime. Mixed regime tide cycles are complex due to different tide signals shifting in and out of phase, so visualising it as a single representative tide cycle will not match the cycle seen on most days.
- Only four constituents are used. The representative tide cycle plot uses only the main tidal constituents which carry most of the deep water tide signal. In shallow water, other tidal constituents can have more of an influence.
- The averaged cycle smooths over variability. Spring/neap variation appears only as the spread band, and single extreme events (storm surge, king tides) are captured only in the separate max/min annotation, not the shape of the averaged curve.
References
- Hart-Davis, M. G. et al. (2021). EOT20: a global ocean tide model from multi-mission satellite altimetry. Earth System Science Data, 13, 3869–3884.
Relevance to mangrove restoration
Tidal range and regime set the vertical width of the intertidal band available for planting, and how often seedlings experience flooding and drying during establishment which is crucial for species selection and zonation design in a restoration plan. A micro-tidal, diurnal site offers a narrow band with one flood/dry cycle a day; a macro-tidal, semidiurnal site offers a wider band with twice the flood exposure, this can affect the decision of which species belong in which tidal zone and influence restoration intervention decisions.